

عالمی بروکر ریگولیشن چیک کرنے والا ایپ
WikiFX
اردو
简体中文
繁體中文
English
Pусский
日本語
ภาษาไทย
Tiếng Việt
Bahasa Indonesia
Español
हिन्दी
Filippiiniläinen
Français
Deutsch
Português
Türkçe
한국어
العربية
اردو


DBG Markets: Market Report for July 17, 2026


خلاصہ۔:Tech Rout Triggers Equities De-Risking Wave US Dollar, Gold Equities Analysis Equities Risk Deeper Correction NowGlobal financial markets are closing out the weekly session under intense pressure thi

Tech Rout Triggers Equities De-Risking Wave
US Dollar, Gold & Equities Analysis Equities Risk Deeper Correction Now
Global financial markets are closing out the weekly session under intense pressure this Friday. The primary catalyst driving the market right now is a sharp resurgence of anxiety regarding tech stock overvaluation and ballooning Artificial Intelligence (AI) capital expenditures.
Today's Focus: The core market question heading into the weekend is whether this valuation correction has further structural room to extend downward or if a technical reversal is building. With market sentiment heavily damaged by the tech exit, headline momentum will dictate immediate price action.
Asset Outlook & Major Trading Zones
US Dollar Outlook: Sideways into the Week Close
The greenback caught a firm fundamental bid late Thursday as global capital fled risk-sensitive growth assets and piled into safe-haven liquidity. This flight to safety has lifted the dollar index precisely at its support level of 100.20, keeping the dollar technically within its recent boundaries.
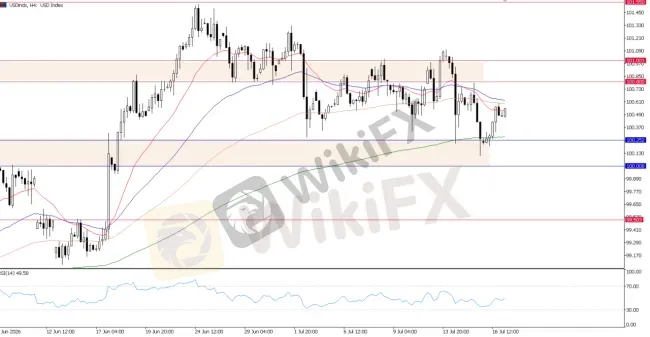
USD Index, H4 Chart
This safe-haven bid will likely extend its range-bound phase, steering the dollar index into a flat and sideways close for the week.
Gold Analysis: $4,000 Under Test Again
Spot gold faces a tough technical hurdle as the dual impact of broad safe-haven dollar accumulation and higher yield pricing forces the metal below a major psychological checkpoint. However, we continue to watch the $4,000 psychological level with cautious attention.
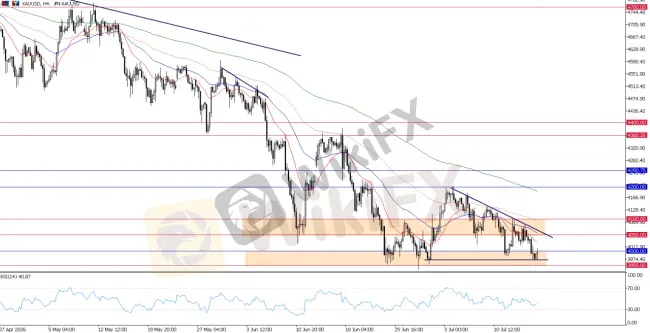
XAUUSD, H4 Chart
While a descending triangle typically points to an eventual bearish breakout, the fact that gold is currently trading at the absolute bottom of the structure rather than the top adds considerable near-term uncertainty.
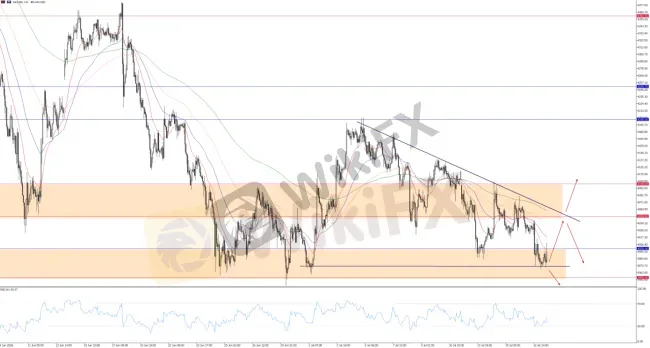
XAUUSD, H1 Chart
Expect a strong technical bounce if the $4,000 level holds, while remaining completely open to a high-volume breakout in either direction of the triangle.
US Indices Analysis: Bull Market at Risk
Nasdaq 100 (UT100)
The high-valuation tech benchmark has sustained serious structural damage following a comprehensive failure of intermediate multi-week support.
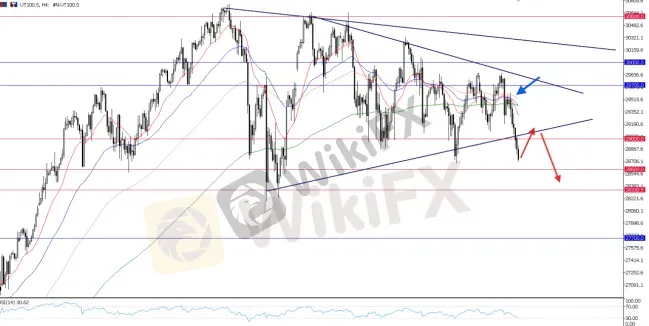
UT100, H4 Chart
The Nasdaq 100 has put its recently formed converging triangle pattern at risk of a major breakdown after forcing a clean close below the 29,000 mark. In the hours ahead, expect short-term sellers to focus on technical retests back toward the flipped 29,000 resistance level.
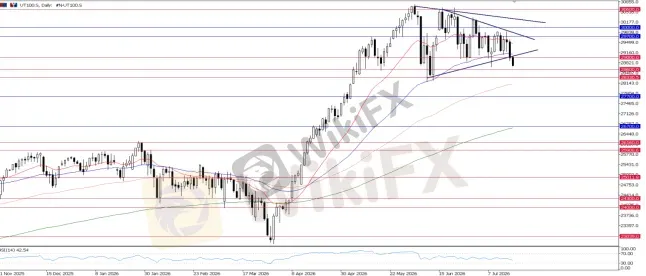
UT100, Daily Chart
Taking a broader view, the Nasdaq 100 has been hovering near historical highs after peaking at 30,600, facing heavy overhead pressure below the 30,000 mark. This price action strongly signals that the bull run may have run into exhaustion and faces a structural breakdown, a risk we have highlighted multiple times in past commentaries.
S&P 500 (US500) Outlook
While the broad-market index has shown more historical resilience than big tech, its high-side technical structure has officially turned heavy.
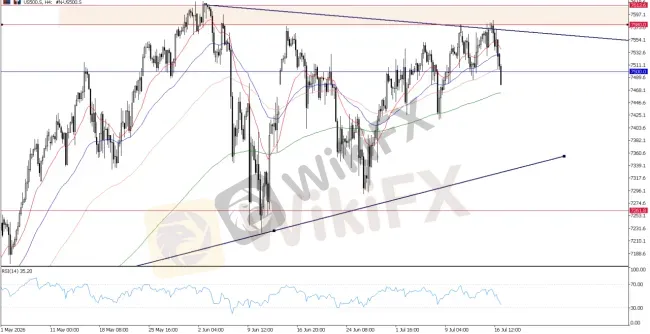
US500, H4 Chart
The S&P 500 failed to build out its record-high momentum as sellers aggressively stepped in near the 7,580 – 7,600 supply wall. The resulting pullback has dragged the index down to a vital technical line in the sand at 7,500.
This level represents the absolute baseline floor for short-term buyers; if the 7,500 mark breaks today, it will trigger a broader, localized corrective phase across US equities that could easily pull global markets down into the weekend close.
Bottom Line & Asset Summary
Global market structures are facing a definitive test as the sudden unwinding of tech valuation premium forces the Nasdaq below 29,000 and gold under $4,000. While the US dollar serves as the primary safe-haven beneficiary within its 100.20 – 101.00 pocket, equity indices are teetering on the edge of deeper corrective steps. Strict adherence to key defensive boundaries—specifically 7,500 on the S&P 500 and the $3,955 – $4,000 zone on gold—is absolutely essential to determine if this de-risking phase will accelerate into the weekend.
· US Dollar Index: Neutral/Consolidating; supported by safe-haven flows above 100.20, expected to finish the week flat below the primary 101.00 resistance ceiling.
· Gold (XAU/USD): Cautiously Bearish; trading underneath the $4,000 milestone within a descending triangle, focusing on the critical $3,955 – $4,000 support belt for immediate direction.
· Nasdaq 100 (UT100): Bearish Breakdown; closed below the vital 29,000 threshold, threatening a major failure of its converging triangle with daily indicators showing structural bull exhaustion.
· S&P 500 (US500): Cautious/Vulnerable; fell back from its 7,580 – 7,600 historical highs to test the primary 7,500 line in the sand, where a breakdown threatens a global sell-off.

ڈس کلیمر:
یہ مضمون صرف مصنف کی ذاتی رائے پر مبنی ہے، یہ پلیٹ فارم کی سرمایہ کاری کی مشورہ نہیں ہے۔ پلیٹ فارم مضمون کی معلومات کی درستگی، مکملیت اور بروقت ہونے کی کوئی ضمانت نہیں دیتا، اور مضمون کی معلومات پر اعتماد یا استعمال سے ہونے والے کسی بھی نقصان کی ذمہ داری قبول نہیں کرتا۔

