US DOLLAR, USD/SGD, USD/THB, USD/PHP, USD/IDR – ASEAN TECHNICAL ANALYSIS
US Dollar outlook remains bearish against ASEAN currencies
USD/SGD eying January lows? USD/THB still appears wobbly
USD/IDR and USD/PHP facing downside technical warnings
SINGAPORE DOLLAR TECHNICAL OUTLOOK
The US Dollar extended declines against the Singapore Dollar since last week, as anticipated. USD/SGD pierced the 1.3375 – 1.3389 inflection zone, confirming the breakout. Now, the 50-day Simple Moving Averaged could cross above the 20-day, forming a bearish crossover. That may precede further losses, opening the door for the pair to retest the 1.3158 – 1.3189 support zone established earlier this year. In the event of a material turn higher however, keep an eye on what may be a falling trendline from March – see chart below.
USD/SGD DAILY CHART
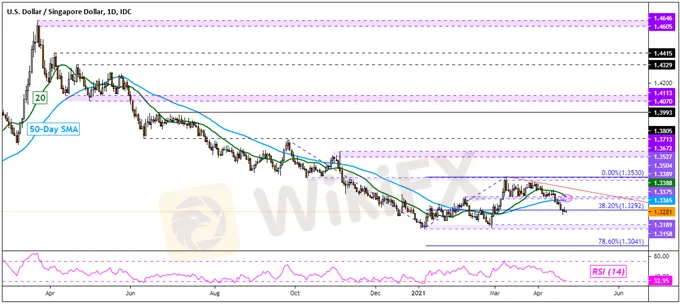
Chart Created in TradingView
THAI BAHT TECHNICAL OUTLOOK
The US Dollar managed to recover slightly against the Thai Baht since last week, but the near-term USD/THB technical picture remains bearish. Prices were contained by the 31.336 inflection point and the Shooting Starstill remains in play. Still, the 20-day SMA seems to be guiding the pair higher. A breakout under would expose the April 15th low and the 38.2% Fibonacci retracement at 31.0633 on the daily chart below. In the event of a push higher however, keep an eye on what seems to be a falling zone of resistance from July.
USD/THB DAILY CHART

Chart Created in TradingView
INDONESIAN RUPIAH TECHNICAL OUTLOOK
The US Dollar could be at risk to the Indonesian Rupiah after USD/IDR fell under a bearish Rising Wedge chart formation. This followed negative RSI divergence, a sign of fading upside momentum. Confirmation of a breakout still seems somewhat lacking, with the 14525 – 14563 inflection zone containing the pair. The 20-day SMA may still keep an upside focus as well. Otherwise, further losses exposes the 50-day SMA followed by former resistance at 14280 which could come into play as new support.
USD/IDR DAILY CHART

Chart Created in TradingView
PHILIPPINE PESO TECHNICAL OUTLOOK
The US Dollar also may be at risk to the Philippine Peso. USD/PHP is attempting to fall under the 48.35 – 48.40 support zone. Granted, the pair does seem to be struggling to do so. But, a bearish crossover between the 50-day and 20-day SMA warns of a downside bias to come. A drop under 48.25 may open the door to revisiting lows from December, where the 47.67 – 47.86 support zone could come into play. Otherwise, turning higher from here could pave the way to retesting the 48.82 – 48.99 resistance zone.
USD/PHP DAILY CHART

Chart Created in TradingView
==========
WikiFX, a global leading broker inquiry platform!
Use WikiFX to get free trading strategies, scam alerts, and experts experience!
╔════════════════╗
Android : cutt.ly/Bkn0jKJ
iOS : cutt.ly/ekn0yOC
╚════════════════╝


