


India Q1 FY27 GDP Growth Hits 7.8%: 3 Scenarios for INR and Gold
India's Q1 FY27 GDP grew 7.8%, beating a 7.4% poll and RBI's 7.0% projection. See three conditional scenarios for INR, rates and gold.
Original

简体中文
繁體中文
English
Pусский
日本語
ภาษาไทย
Tiếng Việt
Bahasa Indonesia
Español
हिन्दी
Filippiiniläinen
Français
Deutsch
Português
Türkçe
한국어
العربية
اردو




Abstract:In this article, we’ll explore CPI and forex trading, looking at what traders should know about the Consumer Price Index to make informed decisions. We’ll cover what CPI is as a concept, the CPI release dates, how to interpret CPI, and what to consider when trading forex against CPI data.
The Consumer Price Index, better known by the acronym CPI, is an important economic indicator released on a regular basis by major economies to give a timely glimpse into current growth and inflation levels.
Inflation tracked through CPI looks specifically at purchasing power and the rise of prices of goods and services in an economy, which can be used to influence a nations monetary policy.
CPI is calculated by averaging price changes for each item in a predetermined basket of consumer goods, including food, energy, and also services such as medical care.
It is a useful indicator for forex traders due to its aforementioned effect on monetary policy and, in turn, interest rates, which have a direct impact on currency strength. The full utility of knowing how to interpret CPI as a forex trader will be explored below.
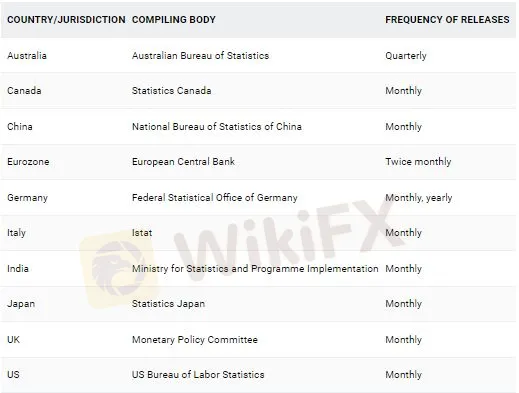
CPI release dates usually occur every month, but in some countries, such as New Zealand and Australia, quarterly. Some nations also offer yearly results, such as Germanys index. The US Bureau of Labor Statistics has reported the CPI monthly since 1913.
The following table shows a selection of major economies and information about their CPI releases.
Understanding CPI data is important to forex traders because it is a strong measure of inflation, which in turn has a significant influence on central bank monetary policy.
So how does CPI affect the economy? Often, higher inflation will translate to higher benchmark interest rates being set by policymakers, to help dampen the economy and subdue the inflationary trend. In turn, the higher a countrys interest rate, the more likely its currency will strengthen. Conversely, countries with lower interest rates often mean weaker currencies.
The release and revision of CPI figures can produce swings in a currencys value against other currencies, meaning potentially favorable volatility from which skilled traders can benefit.
Also, CPI data is often recognized as a useful gauge of the effectiveness of the economic policy of governments in response to the condition of their domestic economy, a factor that forex traders can consider when assessing the likelihood of currency movements.
The CPI can also be used in conjunction with other indicators, such as the Producer Price Index, for forex traders to get a clearer picture of inflationary pressures.
When using CPI data to influence forex trading decisions, traders should consider the market expectations for inflation and what is likely to happen to the currency if these expectations are met, or if they are missed.
Similar to any major release, it may be beneficial to avoid having an open position immediately before. Traders might consider waiting for several minutes after the release before looking for possible trades, since forex spreads could widen significantly right before and after the report.
Below is a chart displaying the monthly inflation rates for the US. For the latest month, expectations are set at 1.6% inflation compared to last years data. If CPI is released higher or lower than expectations this news event does have the ability to influence the market.
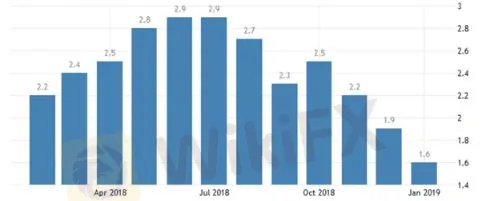
Chart to show US inflation levels in 2018/19. Source: TradingEconomics.com. US Bureau of Labor Statistics
One way the effects of CPI data can be interpreted is by monitoring the US Dollar Index, a 2018/19 example chart for which is below. If CPI is released away from expectations, it is reasonable to believe this may be the catalyst to drive the Index to fresh highs, or to rebound from resistance.
Since the Index is comprised of EUR/USD, USD/JPY, and GBP/USD, by watching the US Dollar we can get a full interpretation of the events outcome.
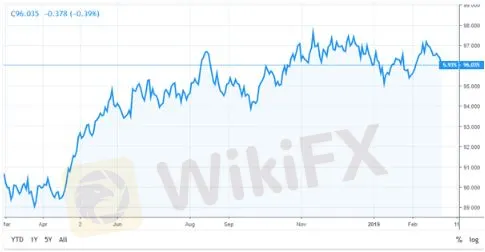
Chart to show movement in the US Dollar Index. Source: TradingView.com
As can be observed in the example above, as inflation rose during the first half of 2018, the US Dollar Index went up accordingly. But with US inflation drifting lower in the following months and with a missed target of 2%, this pushed US interest rate hikes off the agenda. As a result, the dollar struggled and weakened against a basket of other currencies.
Not every fundamental news release works out through price as expected.
Once the CPI data has been released and analyzed, traders should then look to see if the market price is moving through or rebounding off any areas of technical importance. This will help traders understand the short-term strength of the move and/or the strength of technical support or resistance levels, and help them make more informed trading decisions.
Disclaimer:
The views in this article only represent the author's personal views, and do not constitute investment advice on this platform. This platform does not guarantee the accuracy, completeness and timeliness of the information in the article, and will not be liable for any loss caused by the use of or reliance on the information in the article.
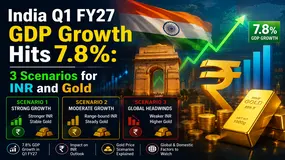
India's Q1 FY27 GDP grew 7.8%, beating a 7.4% poll and RBI's 7.0% projection. See three conditional scenarios for INR, rates and gold.

Choosing a forex liquidity provider is not a search for the lowest displayed spread or the longest provider list. It is a broker decision about pricing integrity, depth, routing, credit, reporting, incident response, and client communication. This 2026 guide explains how a forex LP, FX liquidity provider, or liquidity provider forex arrangement fits into a broker’s execution chain; what to test before onboarding; why a “best forex liquidity provider” claim cannot replace due diligence; and how to compare cost beyond commission. Use the execution-quality scorecard, provider questions, routing scenarios, and 90-day onboarding plan to assess whether a liquidity relationship can support your actual client mix, instruments, risk model, and jurisdiction. The goal is not to make a universal ranking. It is to build evidence that your broker can explain, supervise, reconcile, and recover its execution service when market conditions are difficult.

A forex brokerage launch can look like the fastest route to a modern branded trading environment, but a fast launch is not the same as a controlled launch. This 2026 broker guide explains what the broker platform is, where a technology provider broker solution can sit in a wider operating stack, and how to evaluate the difference between a white label, a server license, and a connected CRM or Client Office setup. It also unpacks broker startup costs beyond the monthly headline, including implementation, integration, support, data, governance, migration, and exit assumptions. Use the practical questions, workflow tests, comparison table, and launch checklist to assess a technology provider without mistaking a feature demo for evidence that your brokerage can run the service safely at scale.
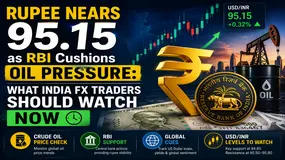
India's rupee is expected to open near 95.14-95.16 per US dollar after closing at 95.2075 on Friday, while Brent crude was quoted at $84.50 and RBI market presence supported the currency. This report separates a reported market intervention from a fixed exchange-rate target, explains why oil, US employment data and Federal Reserve expectations matter, and gives a practical risk checklist for forex trading India. It also explains why volatility is not a reason to trust unverified online forex trading platforms.
WikiFXWikiFXWikiFXWikiFXWikiFXWikiFXWikiFXWikiFXWikiFXWikiFX