


IG Review for India 2026: RBI Alert List, Regulation, Login, and Forex Risk
IG review for India in 2026: see the RBI Alert List entry, overseas regulation, login checks, forex limits, and a clear broker safety checklist.
Original

简体中文
繁體中文
English
Pусский
日本語
ภาษาไทย
Tiếng Việt
Bahasa Indonesia
Español
हिन्दी
Filippiiniläinen
Français
Deutsch
Português
Türkçe
한국어
العربية
اردو




Abstract:Much of trading is waiting. I get it, that’s not what you want to hear. You want action, you want riveting, you want excitement. Heck, this topic is called price ‘action’ so, there surely must be something actionable about it, right?
Well, the problem is, if you‘re not prepared for volatility when it shows up, there’s a very strong chance that you‘ll end up chasing your tail once it does. Most traders do, at least, and this is why many retail traders end up buying highs or selling lows – they get caught up in the excitement of a fast market and they don’t want to miss out (FOMO) but, on the same token they dont quite know what to do.
This is where digestion can be helpful, and I‘m not talking about eating a balanced breakfast. I’m referring to trading setups and the fact that markets, like most humans, operate in cycles. There will often be a burst of activity followed by a pattern of digestion as the market incorporates these new higher/lower prices. It‘s only rationale that traders that were long ahead of a strong spike will look to take profits. And the simple act of some traders taking profits can lead others to do the same, fearful of surrendering gains. And we’ll likely even get the contrarians in the mix, as they look to establish fresh shorts from new highs – all which can relate to a strong price move lower as supply exceeds demand at this new, higher price.
This is simply digestion, and it takes place on all time frames in multitude of ways. But, the devil is in the details, as they say, and digestion can often take the form of a price action pattern that traders can then use to generate trading setups.
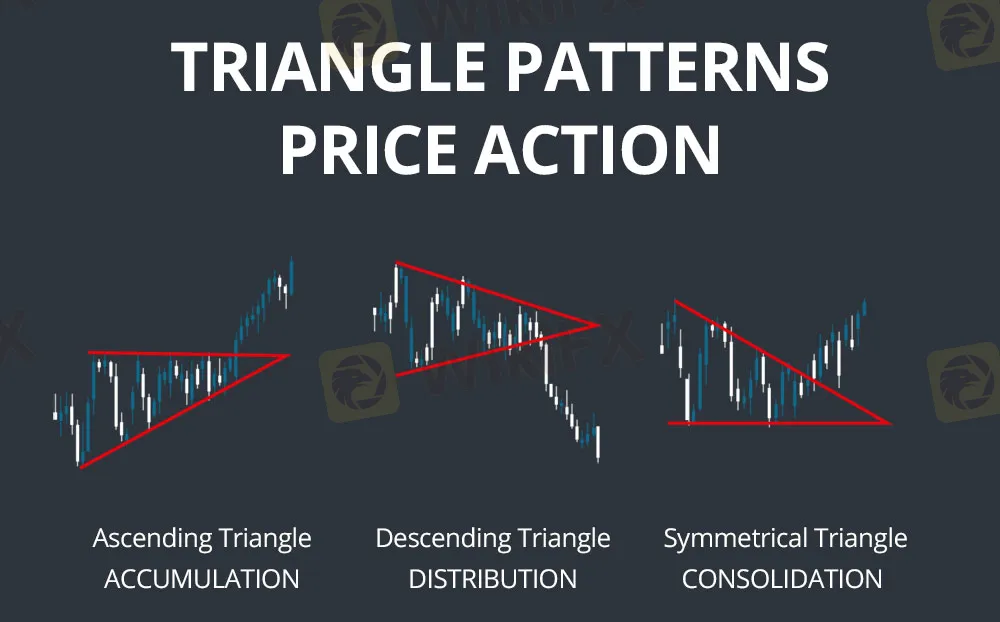
The triangle pattern is one horizontal level and one trend line. Thats it. We have a full article on the ascending triangle, highlighting how a horizontal resistance level can be matched with higher-lows as produced by a bullish trendline to create the formation. The descending triangle, on the other hand, will have a horizontal level of support coupled with a bearish trendline showing lower-highs.
The key here is diminishing marginal impact. And let‘s tell the story from the perspective of a massive level of support, let’s look at an example in USD/JPY.
In early January 2022, USD/JPY set a swing high at 116.35. The pair had pulled back by a little under 300 pips but, a few months later, buyers were again rebuked at that same price. And, again, another pullback ensued – but this time – sellers couldnt drive as far as they could the first.
This is an illustration of that resistance at 116.35 carrying less impact on the second test as buyers had already pushed into that zone. This created an ascending triangle, with horizontal resistance coupled with higher-lows, which you can see on the right side of the below chart.
USD/JPY Daily Price Chart
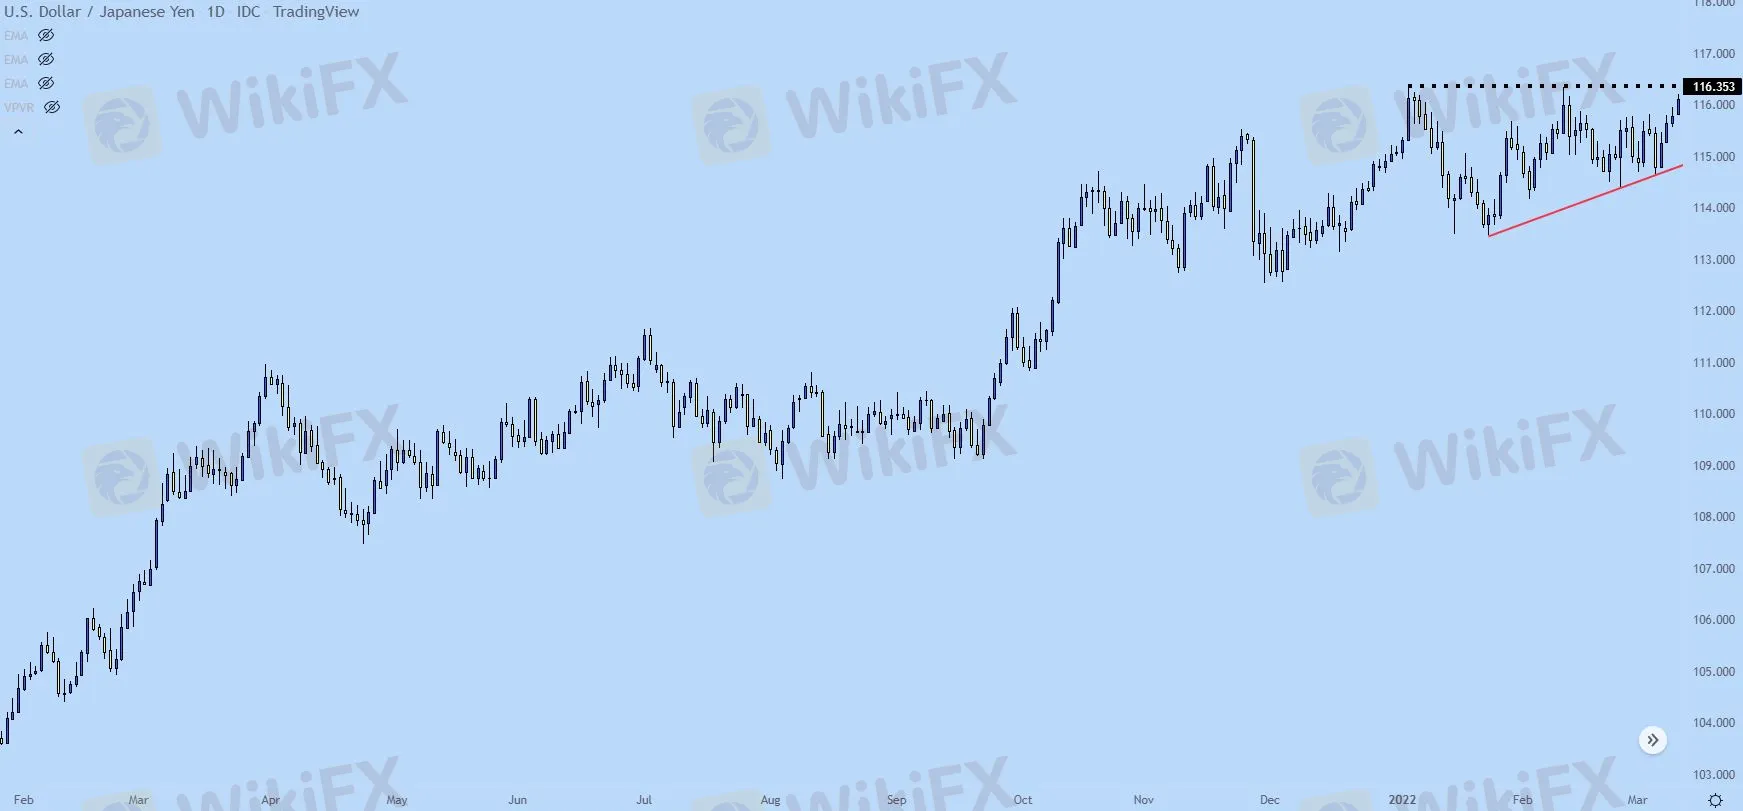
USD/JPY Daily Price Chart

The main difference between the triangle and the wedge is the horizontal support or resistance. In triangle formations, this is a level thats expected to be broken with enough persistence from buyers (for resistance) or sellers (for support).
The falling wedge, on the other hand, is showing that sellers are really aggressive near resistance or at highs while being passive around lows or support. This can often build in due to a major support or resistance level, as sellers look to avoid selling near that key support. But, that itself is deductive, as that passive nature near lows or at support can often lead-in to a reversal scenario, as we look at in our article on the topic of wedges.

Disclaimer:
The views in this article only represent the author's personal views, and do not constitute investment advice on this platform. This platform does not guarantee the accuracy, completeness and timeliness of the information in the article, and will not be liable for any loss caused by the use of or reliance on the information in the article.
IG review for India in 2026: see the RBI Alert List entry, overseas regulation, login checks, forex limits, and a clear broker safety checklist.

Orbex, a Cyprus-based brokerage entity, has recorded 30 exposure complaints on WikiFX, a leading forex broker regulation inquiry tool, so far. Other review websites have also recorded a healthy number of complaints against the brokerage firm. These complaints largely talk about the alleged profit confiscations by the broker in the name of trading violations, difficulty in accessing fund withdrawals, capital losses due to artificial slippage, etc. In this Orbex review, we have investigated user complaints and provided a regulatory overview of the broker.

FCA warns Swift TradeX in a notice first published and updated on 1 September 2026. The UK Financial Conduct Authority says the firm may be providing or promoting financial services without permission, is not authorised, and may be targeting people in the UK. The notice names the website swifttradexai.com, a Worcester address and a UK telephone number, but also cautions that unauthorised businesses may use incorrect or borrowed contact details. The confirmed issue is authorisation status—not a court finding about every transaction. Anyone considering a payment should stop, verify the firm independently, and avoid using contact information supplied by the platform itself.
ThinkMarkets review for India: check the RBI Alert List, overseas entities, regulation, login security, forex rules, costs, withdrawals, and leverage risk.
WikiFXWikiFXWikiFXWikiFXWikiFXWikiFXWikiFXWikiFXWikiFXWikiFX