
Global Broker Regulation Inquiry App
About WikiFX
English
简体中文
繁體中文
English
Pусский
日本語
ภาษาไทย
Tiếng Việt
Bahasa Indonesia
Español
हिन्दी
Filippiiniläinen
Français
Deutsch
Português
Türkçe
한국어
العربية
اردو

FPG USTEC Market Report June 2, 2026
Abstract:On the H4 timeframe chart, USTEC (Nasdaq-100) appears to be continuing its bullish rally after previously experiencing a temporary loss of momentum. As shown on the chart, USTEC has been in a strong a
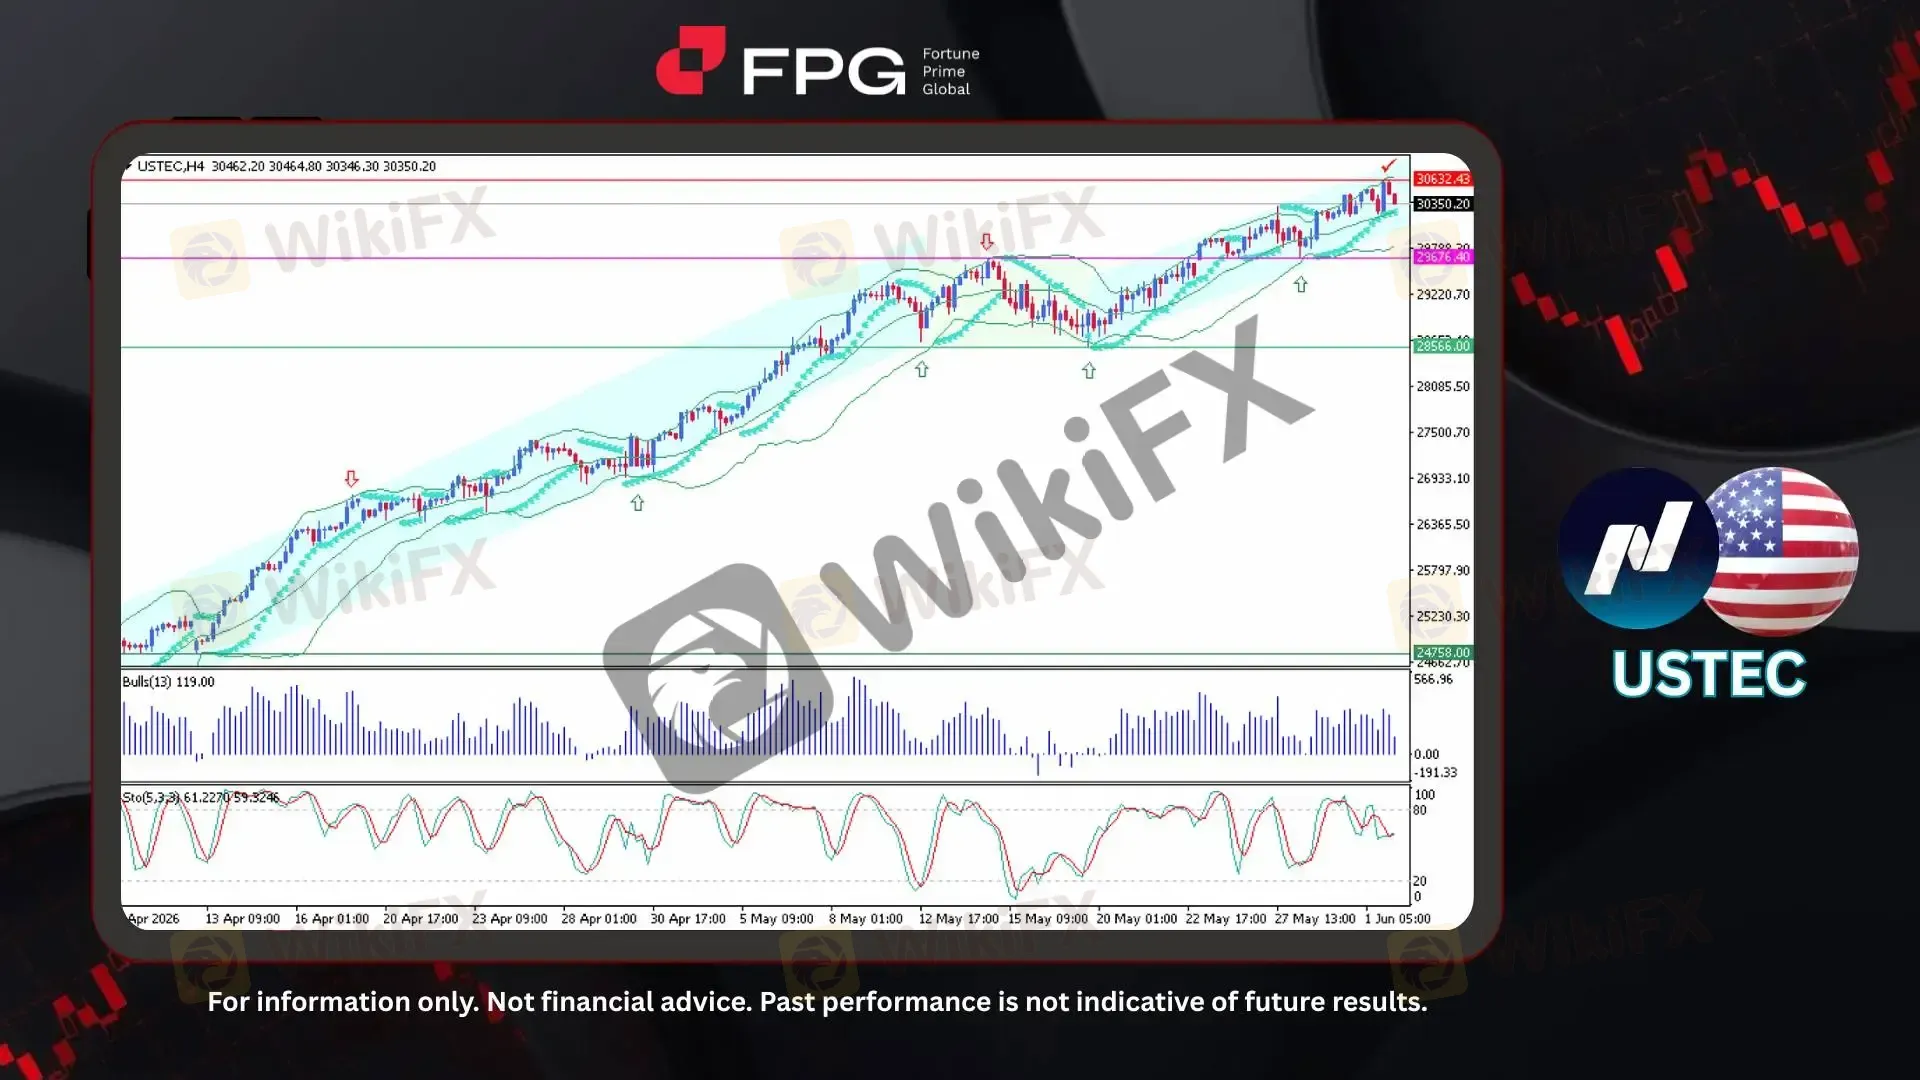
On the H4 timeframe chart, USTEC (Nasdaq-100) appears to be continuing its bullish rally after previously experiencing a temporary loss of momentum. As shown on the chart, USTEC has been in a strong and extended bullish trend for several months, forming a well-defined ascending channel. However, the market previously showed signs of exhaustion and moved sideways within the 28,566–29,676 area. Following that consolidation phase, bullish momentum resumed and pushed the index to a new record all-time high around 30,632. The current price is trading near 30,350, and there remains potential for the bullish trend to continue.
From a technical perspective, the overall bullish structure remains intact as price continues to trade above the ascending support trendline and remains within the upper portion of the bullish channel. The Bollinger Bands are still expanding moderately, indicating that volatility remains supportive of the prevailing upward trend, although the latest candles show a mild pullback from the recent all-time high area. Meanwhile, the Bulls Power indicator remains in positive territory, suggesting that buyers continue to maintain control of the broader market direction despite some short-term profit-taking activity. The Stochastic oscillator has turned lower from overbought territory and is currently moving around the mid-to-upper range, reflecting a temporary cooling of momentum rather than a confirmed trend reversal. As long as price remains above the 29,676 support area, the broader bullish outlook remains favored.
Recent global economic developments continue to highlight strong AI investment, resilient U.S. economic activity, growing semiconductor demand, supportive technology earnings, and ongoing expectations surrounding future Federal Reserve policy decisions. These factors have helped sustain positive sentiment across the technology sector, encouraging continued capital flows into growth-oriented assets despite persistent geopolitical and macroeconomic uncertainties. As a result, USTEC remains supported by strong underlying fundamentals and continues to maintain a consistent bullish bias. Traders should also keep in mind that USTEC typically reacts most actively during the U.S. session, particularly around major economic releases, Federal Reserve speeches, and high-impact corporate earnings announcements.
Technical Market Overview
1. Current Position: USTEC remains in a strong bullish trend on the H4 timeframe, currently trading near 30,350 after recently recording a new all-time high around 30,632. Price continues to hold within a well-defined ascending channel, indicating that the broader upward momentum remains intact.
2. Resistance Zone: The nearest resistance zone is located around 30,632, which represents the recent all-time high and a key bullish breakout area. A sustained move above this level could encourage further buying interest and support continued upside expansion.
3. Support Zone: The first support zone is located around 29,676, followed by stronger support near 28,566. As long as price remains above these levels, the broader bullish structure is expected to remain valid.
4. Indicator Observation: Bollinger Bands remain moderately expanded while Bulls Power stays in positive territory, reflecting ongoing bullish market conditions. Meanwhile, the Stochastic oscillator has eased from overbought territory, suggesting a temporary slowdown in momentum rather than a confirmed trend reversal.
5. Technical Summary: The overall technical outlook remains bullish as price continues to trade above key support levels and within the ascending channel structure. Although short-term consolidation may occur following the recent all-time high, the broader trend continues to favor further upside potential.
Market Performance:
Indices Last Price % Change
US500 7,577 −0.30%
US30 50,860 −0.33%
Today's Key Economic Calendar:
AU: Building Permits MoM Preliminary
AU: Company Gross Profits QoQ
US: Fed Kashkari Speech
UK: BoE Consumer Credit
UK: Mortgage Approvals & Lending
EU: Core Inflation Rate YoY Flash
EU: Inflation Rate MoM & YoY Flash
US: Fed Hammack Speech
US: JOLTs Job Openings
Disclaimer:
The views in this article only represent the author's personal views, and do not constitute investment advice on this platform. This platform does not guarantee the accuracy, completeness and timeliness of the information in the article, and will not be liable for any loss caused by the use of or reliance on the information in the article.
WikiFX Broker
Latest News
BONUS Review 2025: Is This Forex Broker Safe?
 WikiFX
Trading.com Secures MiCA Licence in Cyprus as Crypto Access Becomes Part of Its EU Strategy
WikiFXThe Hidden Risks of Margin Calls and How to Trade Trends Safely
WikiFXT4Trade Review 2026: Official Warnings and Withdrawal Risks
WikiFXLONG ASIA Review 2026: Withdrawal Complaints and Unverified Regulation
WikiFXTotalFX Dangles 1:1000 Leverage and a $0 Minimum Deposit - But Is Its Regulation Strong?
WikiFXPay a 17% Tax First, Then You Can Withdraw" — How Nixse Allegedly Held One Trader's €25,000 Hostage
WikiFXTD MARKETS Review 2026: Is This Forex Broker Safe?
WikiFXManual vs. Mechanical Trading: Turning Market Feel Into Automated Rules on MT5
WikiFXUITFX Review 2026: Unregulated Status and Withdrawal Warnings
WikiFXCurrency Calculator
USD

CNY
Current Rate:0
Enter amount
USD
Redeemable Amount
CNY
Calculate 