

Global Broker Regulation Inquiry App
About WikiFX
English
简体中文
繁體中文
English
Pусский
日本語
ภาษาไทย
Tiếng Việt
Bahasa Indonesia
Español
हिन्दी
Filippiiniläinen
Français
Deutsch
Português
Türkçe
한국어
العربية
اردو


FPG USDCAD Market Report September 3, 2026


Abstract:On the H1 timeframe, USDCAD has just experienced a steep pullback after a stretch of heightened volatility. Over the past week, price action has been erratic, characterized by repeated trend reversals
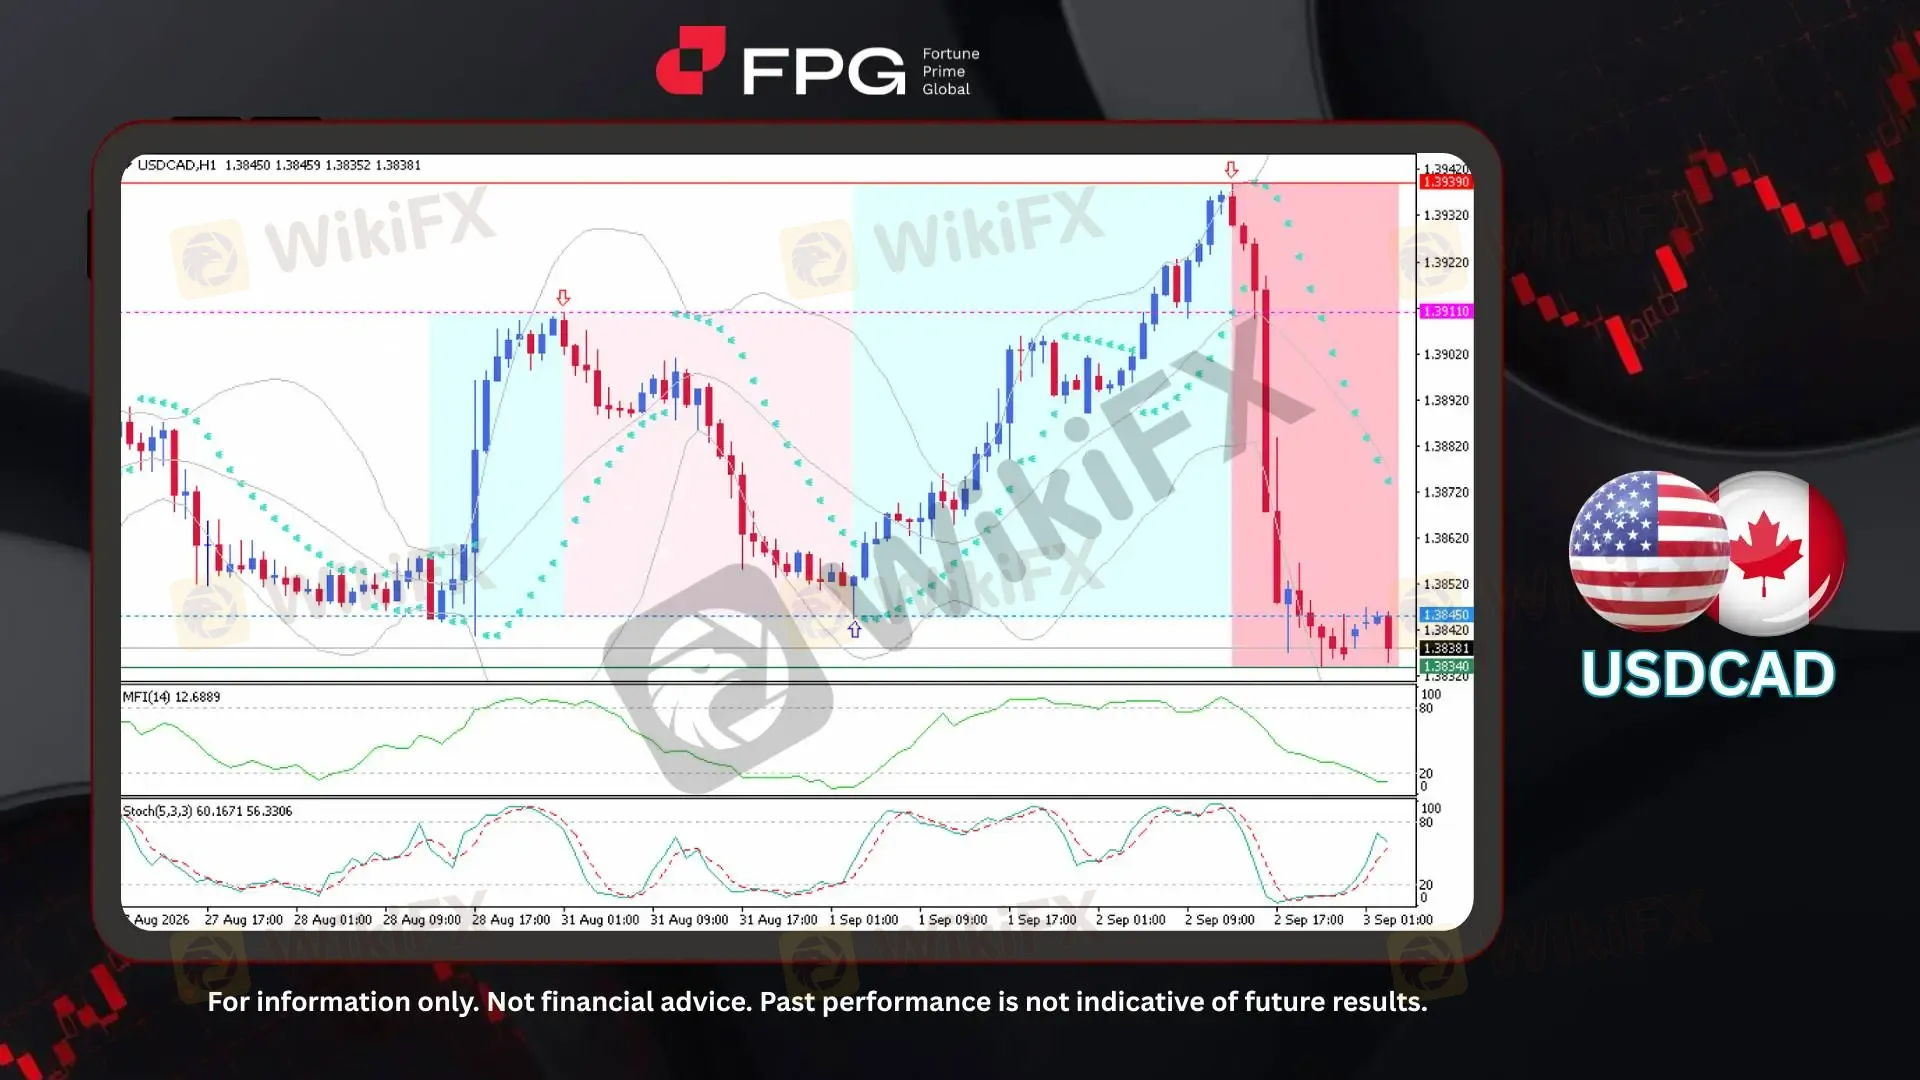
On the H1 timeframe, USDCAD has just experienced a steep pullback after a stretch of heightened volatility. Over the past week, price action has been erratic, characterized by repeated trend reversals rather than sustained directional movement. In the latest downswing, the pair retreated from a high of 1.3939 to a low around 1.3834, with USDCAD now trading around 1.3838. Given the persistently elevated volatility, further sharp price swings remain likely in the sessions ahead.
Technical indicators reinforce this picture of an overextended move. The Bollinger Bands remain notably wide, confirming that volatility is running well above average. The Parabolic SAR dots sit above price, signaling that bearish momentum continues to dominate the near-term trend. That said, momentum oscillators are flashing early signs of exhaustion: the Money Flow Index has plunged to 12.69, placing it firmly in oversold territory and pointing to the intensity of recent selling pressure. Similarly, the Stochastic oscillator has turned higher from oversold levels, with the %K line (60.17) crossing above %D (56.33), a signal that often precedes a short-term corrective bounce, even if the broader downtrend remains intact.
The fundamental backdrop has reinforced this bearish shift over the past week. In the US, manufacturing activity held in expansion territory through August, jobless claims stayed relatively subdued, and the trade deficit widened further, a combination that has offered only limited support to the dollar. Across the border, Canada's economy expanded at a robust 3.3% annualized pace in the second quarter, while the Bank of Canada's most recent policy decision held rates steady at 2.25%, accompanied by a cautious, relatively hawkish tone amid persistent inflationary pressures. Combined with firmer oil prices and growing expectations of tighter BoC policy ahead, the Canadian dollar has found renewed support in recent sessions, a key driver behind USDCAD's sharp pullback from its early-week highs.
Technical Market Overview
1. Current Position: USDCAD is trading at 1.3838, after completing a sharp decline from the 1.3939 region. Price is currently hovering just above the 1.3834 support level, following one of the most volatile sessions of the past week.
2. Resistance Zone: Immediate resistance is seen at 1.3911, marking the level from which the recent bearish momentum accelerated. A stronger resistance zone sits at 1.3939, the swing high and origin of the latest sell-off. A sustained break above 1.3911 would be needed to ease near-term bearish pressure.
3. Support Zone: A support level lies at 1.3834, which currently aligns closely with the market price and represents a critical floor, a break below this level could open the door to further downside.
4. Indicator Observation: The Bollinger Bands remain significantly widened, confirming elevated volatility following the recent expansion move. The Parabolic SAR dots are positioned above price, indicating that bearish momentum remains in control. However, the MFI has dropped to 12.69, deep in oversold territory, while the Stochastic oscillator (%K 60.17, %D 56.33) has curled higher, both pointing to fading downside momentum and raising the potential for a short-term corrective bounce.
5. Technical Summary: USDCAD remains under bearish pressure following its sharp drop from 1.3939, with price now testing key support near 1.3834–1.3845. While the broader trend favors sellers, oversold momentum readings suggest the pair is vulnerable to a near-term relief bounce toward the 1.3911 resistance zone. A decisive break below 1.3834 would reinforce bearish continuation, whereas a reclaim above 1.3911 would signal a shift back toward consolidation or recovery.
Market Performance:
Forex Last Price % Change
EUR/USD 1.1589 +0.01%
GBP/USD 1.3487 +0.01%
Key Economic Calendar:
AU: RBA Jones Speech
AU: Balance of Trade
CN: RD Services PMI
AU: RBA Hunter Speech
US: Balance of Trade
CA: Balance of Trade
US: Exports & Imports
US: Fed Waller Speech
US: Initial Jobless Claims
US: ISM Services PMI
Risk Disclaimer: This report is for informational purposes only and does not constitute financial advice. Investments involve risks, and past performance does not guarantee future results. Consult your financial advisor for personalized investment strategies.
Disclaimer:
The views in this article only represent the author's personal views, and do not constitute investment advice on this platform. This platform does not guarantee the accuracy, completeness and timeliness of the information in the article, and will not be liable for any loss caused by the use of or reliance on the information in the article.
WikiFX Broker
Latest News
GODO Expands Global Regulatory Footprint With CySEC and FSCA Licences
 WikiFX
India: Growth outlook revised higher – Standard Chartered
WikiFXNeomarkets Review 2026: Investors Report Scams & Unfair Charges
WikiFXNXG MARKETS Review 2026: India RBI Alert, Regulation, Login, and Risk
WikiFXSilver Price Forecast: XAG/USD trades flat around $66.60 ahead of US data
WikiFXAustralian Dollar steady above 0.7150 vs USD on trade data, China PMI
WikiFXCanadian Dollar Holds Near 1.386 Ahead of Bank of Canada Decision
WikiFXLove Scam Cost RM260,000 Debt and Family Tragedy of 4 Deaths
WikiFXEuro holds gains above 1.1600 ahead of Eurozone HICP inflation data
WikiFXVantage Broker Review: Regulated but is it Safe for Traders?
WikiFX