
Applicazione di richiesta di informazioni sulla regolamentazione dei broker globali
WikiFX
English
简体中文
繁體中文
English
Pусский
日本語
ภาษาไทย
Tiếng Việt
Bahasa Indonesia
Español
हिन्दी
Filippiiniläinen
Français
Deutsch
Português
Türkçe
한국어
العربية
DBG Markets: Market Report for Mar 2, 2026
Sommario:Weekly Outlook: Middle East War Plunges Global Equities; Crude Oil and Safe-Havens SoarThe global market narrative has experienced a catastrophic structural shift over the weekend. The diplomatic opti
Weekly Outlook: Middle East War Plunges Global Equities; Crude Oil and Safe-Havens Soar
The global market narrative has experienced a catastrophic structural shift over the weekend. The diplomatic optimism surrounding US-Iran talks has completely evaporated, replaced by a sudden and massive war breakout in the Middle East. Combined with hotter-than-expected US inflation data, investors are bracing for extreme volatility across all asset classes.
US-Iran War Breakout & What's Next
The global market opened the first trading day of March with a broad gap down following a sudden and unprecedented escalation in Middle East tensions. Over the weekend, the US and Israel launched a massive coordinated military campaign, precisely targeting critical Iranian infrastructure and leadership compounds in Tehran.
With Iranian state media confirming the deaths of Supreme Leader Ali Khamenei, the defense minister, and top IRGC commanders, Iran and its proxy forces have launched immediate retaliatory strikes against Israel and US military installations in Arab Gulf states.
WTI (USOIL) Outlook
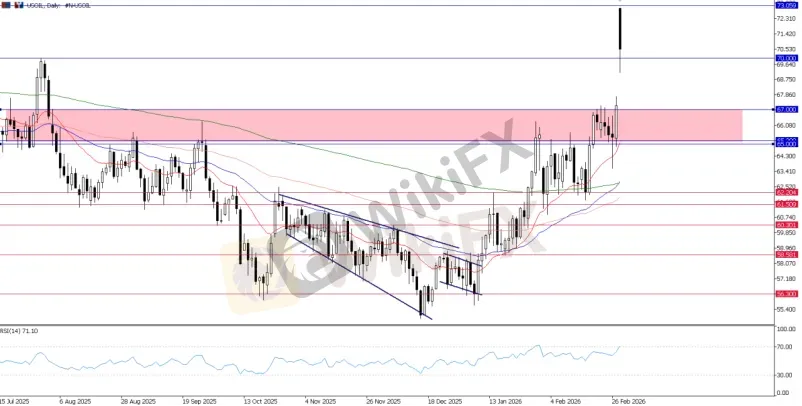
USOIL, Daily Chart
Technically, WTI (USOIL) is entering an expected pullback phase to fill the gap. The $70 per barrel psychological mark has become the immediate key support, with $67 establishing a more formidable defense line.
The ongoing war dynamics will highly likely keep oil prices firmly elevated, gathering new rebound momentum after testing and stabilizing above these critical support zones.
In the near-term, USOIL is expected to stay elevated above the $67 level, while $70 forms the immediate support floor.
Brent (UKOIL) Outlook
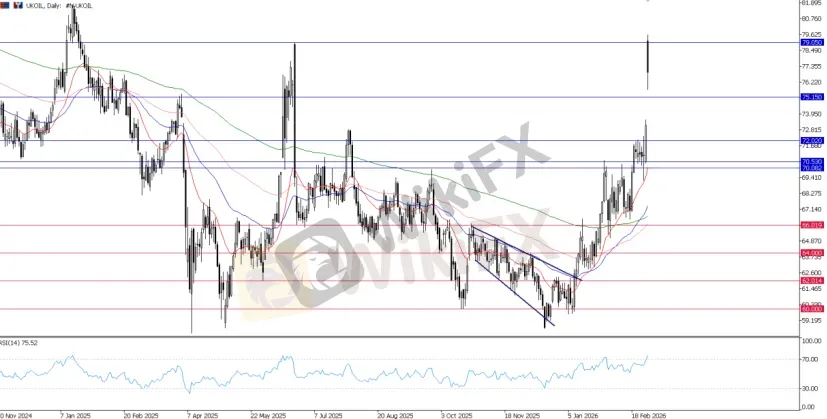
UKOIL, Daily Chart
Similarly, for UKOIL, $79 acts as an immediate ceiling, which coincides with the June 2025 high. The immediate support lies at $75, while the major support floor rests at $72.00.
Crude Oil Outlook Summary:
Both crude oil benchmarks are expected to stay elevated near their breakout zones. Following today's gap-up open, a period of technical pullback to fill the gap is anticipated, but the broader outlook keeps oil elevated amidst such profound uncertainty.
Unless we see a clear signal of de-escalation—such as a return to US-Iran negotiations—oil prices will likely remain elevated above their current ranges.
Gold Dominates Safe-Have Headline
Meanwhile, in the gold market, global capital is aggressively fleeing into safe-haven assets to hedge against the risks of a broader Middle East conflict, providing immensely strong support for precious metals. Gold gapped up to a near one-month high at the open, approaching $5,370/oz, while Silver also gapped higher to open near $96.38/oz.
The yellow metal will undoubtedly serve as the market's primary shield against geopolitical uncertainty.
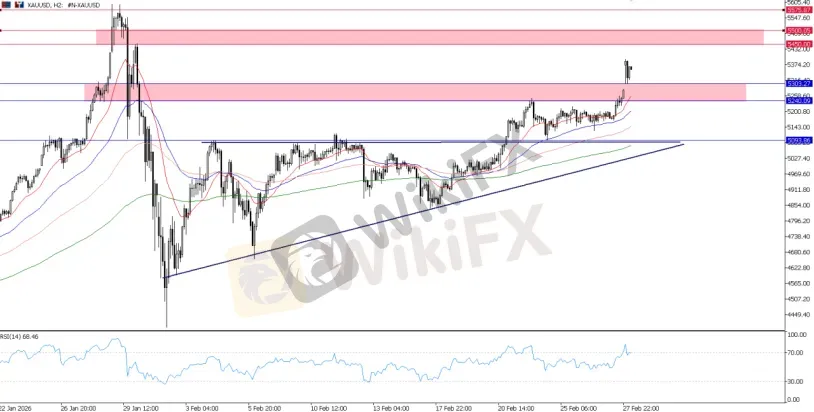
XAUUSD, H2 Chart
With Gold breaking above the 5240 – 5300 zone, the precious metal has opened the door for another leg up, establishing its immediate support base in this same 5240 – 5300 area. Heightened political uncertainty, combined with near-term US inflation risks following last week's upside surprise in the PPI, keeps the environment highly favorable for Gold.
Heading into this week, watch the 5240 – 5300 bases closely; any further upside momentum will likely send Gold into the next liquidity zone near the 5450 – 5500 area.
US Dollar: War Breakout & Recent PPI
The US Dollar is being fueled by a powerful dual catalyst: massive safe-haven inflows and surging domestic inflation data. At Monday's open, the US Dollar Index gapped up, briefly touching a six-week high near 98.00 before paring some of its gains.
Adding to the bullish dollar narrative, January's Producer Price Index (PPI) surged unexpectedly. Core PPI jumped 3.6% YoY (vs. 3.0% consensus) and 0.8% MoM (vs. 0.3% consensus). This robust PPI data, combined with recently elevated inflation metrics, has further pushed back market expectations for Federal Reserve rate cuts, solidifying the Dollar's position as a high-yielding safe haven amidst the chaos.
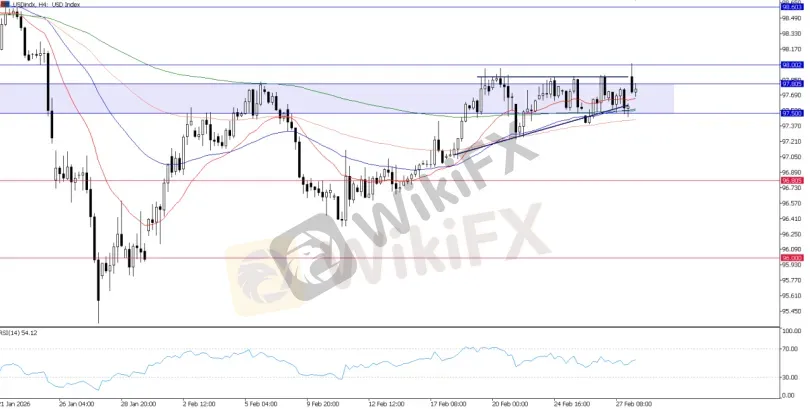
USD Index, H4 Chart
if the Dollar fails to regain ground above the 97.80 – 98.00 zone, the bullish catalysts mentioned above are not enough to fully support the Dollar bulls. A clear break above 98.00 is still needed for us to shift the outlook into a truly bullish stance for today.
Outlook: Continue watching for a breakout in either direction: a 98.00 bullish breakout or a 97.50 bearish breakdown.
US Indices Risk
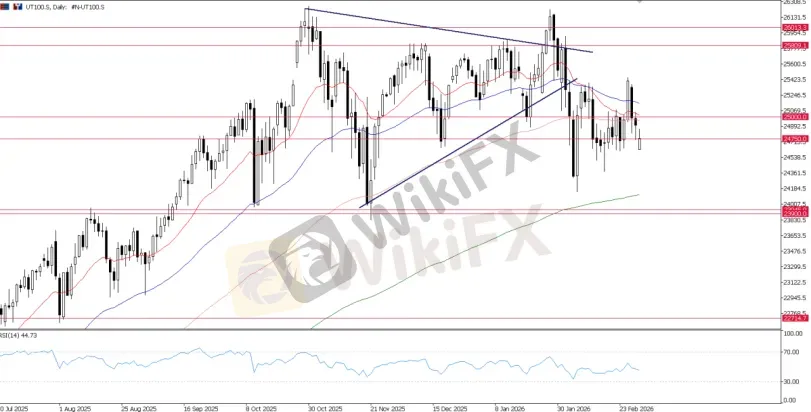
UT100, Daily Chart
The outlook for the Nasdaq heading into this week remains unchanged from what we covered earlier. With continuous pressure pushing the Nasdaq back below the 25,000 level, combined with broader macro uncertainty, the overall outlook this week remains heavily skewed toward risk aversion.
Bottom Line & What's Next
The market paradigm has violently shifted from a focus on tech earnings and tariffs to an outright geopolitical crisis. Geopolitics and inflation are now completely in the driver's seat.

Disclaimer:
Le opinioni di questo articolo rappresentano solo le opinioni personali dell’autore e non costituiscono consulenza in materia di investimenti per questa piattaforma. La piattaforma non garantisce l’accuratezza, la completezza e la tempestività delle informazioni relative all’articolo, né è responsabile delle perdite causate dall’uso o dall’affidamento delle informazioni relative all’articolo.
WikiFX Trader
D prime
Supervisione del paese
GO Markets
Sotto supervisione
VT Markets
Sotto supervisione
FOREX.com
Supervisione del paese
Vantage
Sotto supervisione
GTCFX
Sotto supervisione
D prime
Supervisione del paese
GO Markets
Sotto supervisione
VT Markets
Sotto supervisione
FOREX.com
Supervisione del paese
Vantage
Sotto supervisione
GTCFX
Sotto supervisione
Rate Calc
USD

CNY
Tasso di cambio attuale:0
inserisci l'importo
USD
A disposizione
CNY
Calcolare 