
Applicazione di richiesta di informazioni sulla regolamentazione dei broker globali
WikiFX
English
简体中文
繁體中文
English
Pусский
日本語
ภาษาไทย
Tiếng Việt
Bahasa Indonesia
Español
हिन्दी
Filippiiniläinen
Français
Deutsch
Português
Türkçe
한국어
العربية
DBG Markets | Understanding Technical Analysis in FX, Commodities & Indices CFDs (Part 1)
Sommario:Understanding Technical Analysis in FX, Commodities Indices CFDs (Part 1)Understanding both fundamental and technical analysis is a crucial first step in trading the financial markets. While fundamen

Understanding Technical Analysis in FX, Commodities & Indices CFDs (Part 1)
Understanding both fundamental and technical analysis is a crucial first step in trading the financial markets. While fundamental analysis focuses on economic data, news, and macro trends, this guide will help you get started with technical analysis—a key tool for analyzing price movements and making informed trading decisions.
1. What is Technical Analysis?
Technical analysis is a method used by traders and investors to evaluate and forecast price movements by analyzing historical price data and trading volume.
Unlike fundamental analysis, which looks at the underlying value of an asset, technical analysis focuses purely on price action and market behaviour.
It can be applied across all major markets—including Forex (FX), commodities, indices, stocks, and cryptocurrencies—and is especially popular among short-term traders like scalpers and swing traders.
1.1 Core Principles of Technical Analysis
To help reader have the better understand, technical Analysis is based on three key principles:
Price movements incorporate all relevant factors, including fundamentals, news, and investor sentiment.History Repeats ItselfMarket behavior is cyclical. Price patterns tend to recur over time due to consistent human psychology.Identifying a trendPrices usually move in identifiable trends: uptrend, downtrend, or sideways. Recognizing these trends is essential to technical analysis.
We can see it this way: Fundamental Analysis studies the “Why”—the economic reasons, interest rates, and geopolitical shifts that determine what an asset should be worth.
Technical Analysis, on the other hand, studies the “What”—the actual price behavior and market conviction.
2. Why Use technical Analysis
Technical analysis is one of the most practical tools for traders, especially in fast-moving markets like Forex, commodities, and indices CFDs. It helps traders make informed decisions by studying price action and identifying potential trading opportunities based on market behavior.
Help Identify Entry & Exit Points
One of the main goals of any trader is to enter a trade at the right time—and exit with a profit. Technical analysis provides visual tools and indicators that help:
· Pinpoint when to enter a trade (e.g. when a price breaks above resistance)
· Identify when to exit (e.g. when momentum slows down or a trend reverses)
Example: If a trader sees that a currency pair has bounced off a support level several times, they may decide to enter a buy position there, aiming to sell when price nears resistance.
In fact, the technical analysis is important for several other reason and here is why:
Works Across All TimeframeTechnical analysis adapts to any timeframe, whether you are a scalper, swing trader or position tradersApplicable to Any MarketsThe same principles can be applied to Forex, commodities, indices, stocks, or crypto—anywhere price data is available.Improves Risk ManagementTraders use technical tools to define risk:reward ratio, such as identifying stop-loss and take-profit level.
3. Identifying Trend in Technical Analysis
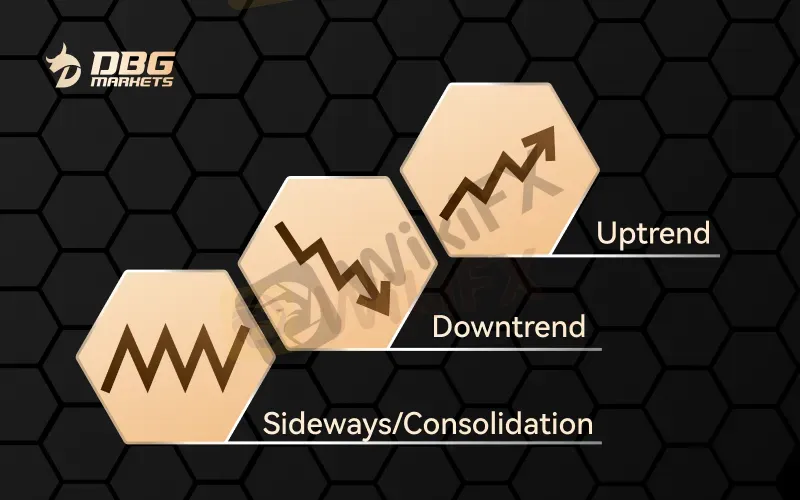
One of the most powerful concepts in technical analysis is trend identification. A trend refers to the general direction in which the price of an asset is moving over a period of time.
Identifying and following the trend is often considered one of the most effective strategies in trading. In financial markets, price rarely moves in a straight line. Instead, it moves in waves, forming recognizable patterns that make up trends.
Types of TrendCharacteristicsMarket SentimentUptrend (Bullish Market)Higher highs and higher lowsIndicates buying momentumDowntrend (Bearish market)Lower highs and lower lowsReflects dominant selling pressureSideways/Range-BoundPrice oscillates between support & resistanceSuggests indecision or low volatility
Recognizing the current market trend helps traders align their strategies with the broader direction, whether that means riding the trend or preparing for potential reversals. In this process, technical analysis plays a vital role, offering visual and statistical tools to help confirm the trends strength and direction.
Disclaimer:
Le opinioni di questo articolo rappresentano solo le opinioni personali dell’autore e non costituiscono consulenza in materia di investimenti per questa piattaforma. La piattaforma non garantisce l’accuratezza, la completezza e la tempestività delle informazioni relative all’articolo, né è responsabile delle perdite causate dall’uso o dall’affidamento delle informazioni relative all’articolo.
WikiFX Trader
GO Markets
Sotto supervisione
AVATRADE
Sotto supervisione
FOREX.com
Supervisione del paese
TMGM
Sotto supervisione
Exness
Sotto supervisione
IC Markets Global
Sotto supervisione
GO Markets
Sotto supervisione
AVATRADE
Sotto supervisione
FOREX.com
Supervisione del paese
TMGM
Sotto supervisione
Exness
Sotto supervisione
IC Markets Global
Sotto supervisione
Rate Calc
USD

CNY
Tasso di cambio attuale:0
inserisci l'importo
USD
A disposizione
CNY
Calcolare 